Chapter 6: Graphs and Trees
Section 6.1 Graphs and Their Representations
Graphs are a fundamental concept in discrete mathematics that represent relationships between objects. They are widely used in computer science, transportation, social networks, chemistry, and artificial intelligence. This section explains what graphs are, their different types, and their representations.
Graph and Their Representations
Graphs are formal mathematical representations of networks, collections of objects, events, or set elements that lead naturally from one to another.Graph (Informal Definition)
A graph is a collection of nodes (vertices) connected by edges (arcs). These connections represent relationships between entities. A graph is a nonempty set of nodes(vertices) and a set of arcs(edges) such that each arc connects two nodes.Our graphs will always have a finite number of nodes and arcs.
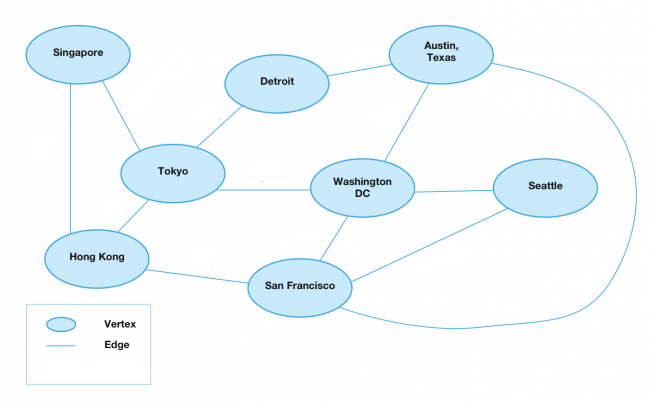
Example 1: Graph Representing Cities
This graph visually represents airline connections between major cities. In the graph below, the vertices represents the cities, and the edges are the distance between them.
The set of nodes in the airline map of Figure 1 is {Singapore, Tokyo, Hong Kong, Detroit, Austin, Washington, Seattle, San Francisco}. There are 12 arcs; Singapore-Tokyo is an arc (here we are naming an arc by the nodes it connects), Detroit-Austin is an arc, and so on.
The informal definition of a graph works quite well if we have the visual representation of the graph before us to show which arcs connect which nodes. Without the picture, however, we need a concise way to convey this information. Hence our second definition of a graph.
Graph (Formal Definition)
A graph G is an ordered pair G=(V,E) where• V is a nonempty set of nodes(vertices)
• E is a set of arcs(edges)
• Each edge is a pair of vertices.
In other words, each element of E is a pair of elements of V.
Example 2: Simple Graph Representation
In the graph below, the vertices represents the circles, and the edges are the lines between them.
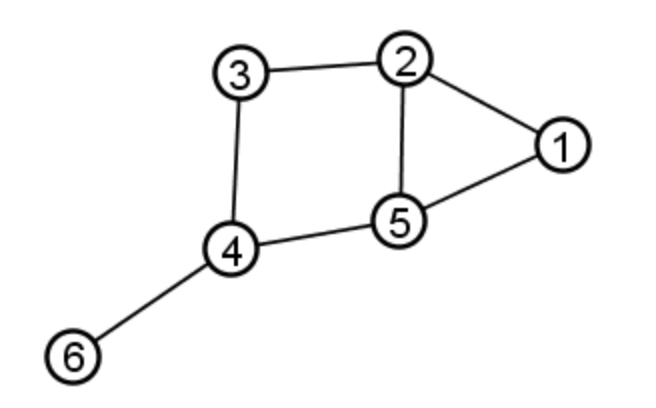
For the graph of Figure 2 represents the following graph:
• V = {1,2,3,4,5,6}
• E = {{1,2}, {1,5}, {2,3}, {2,5} {3,4}, {4,5}, {4,6}}
• G = (V,E)
This graph can represent a network, a road system, or even a social connection.
Undirected and Directed
Undirected graph: An undirected graph has edges with no direction. The edges of a graph are assumed to be unordered pairs of nodes. Sometimes we use an undirected graph to emphasize this point. In an undirected graph, we write edges using curly braces to denote unordered pairs. For example, an undirected edge {2,3} from vertex 2 to vertex 3 is the same thing as an undirected edge {3,2} from vertex 3 to vertex 2.Direct graph: A directed graph (digraph) has edges with a direction. In a directed graph, the two directions are counted as being distinct directed edges. In a directed graph, we write edges using parentheses to denote ordered pairs. For example, edge (2,3) is directed from 2 to 3, which is different than the directed edge (3,2) from 3 to 2. Directed graphs are drawn with arrowheads on the links, as shown below:
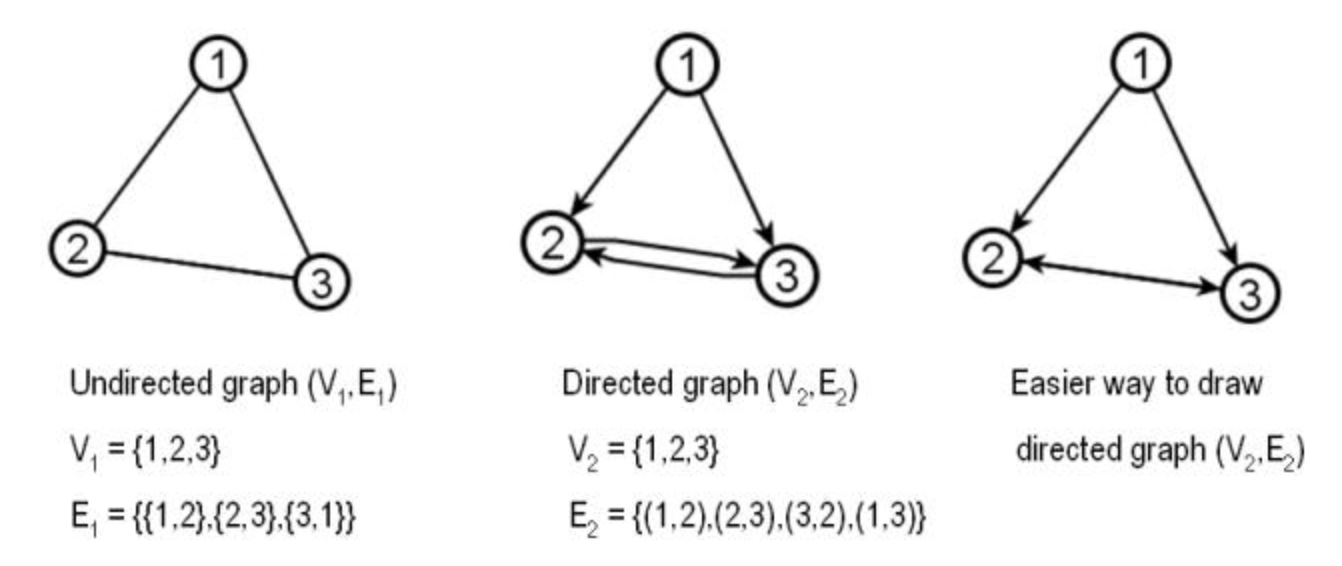
In this class, the term "graph" will mean an undirected graph. To refer to a directed graph, we will always say "directed graph".
Labeled Graph and Weighted Graph
Besides imposing direction on the arcs of a graph, we may want to modify the basic definiton of a graph in other ways. We often want the nodes of a graph to carry identifying information, like the names of the cities in the map of airline routes. This map would be a labeled graph . We may want to use a weighted graph , where each arc has some numerical value, or weight, associated with it. For example, we might want to indicate the price of the various routes in the airline map.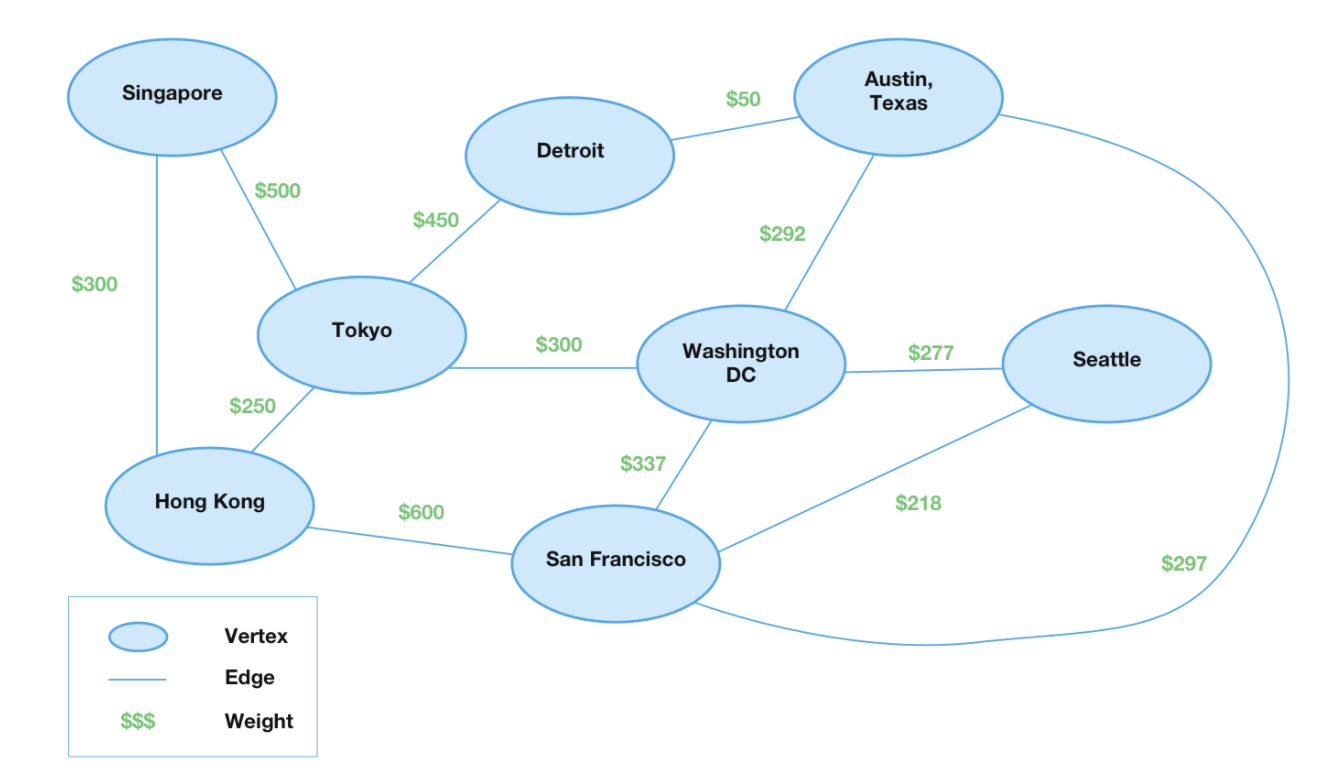
Figure 4 represents a labeled and weighted graph, where each edge has a numerical value indicating the price.
Labeled Graph
- ♦ A labeled graph assigns unique names or values to vertices.
- ♦ Example: A flight network where cities are labeled (New York, London, Tokyo, etc.).
Weighted Graph
A weighted graph assigns numerical values to edges, often representing:- ♦ Cost (e.g., flight ticket prices).
- ♦ Distance (e.g., road networks).
- ♦ Time (e.g., shortest path in Google Maps).
Applications of Graphs
(1) The Internet (Web Graph)
(2) Transportation Networks
Graphs also play an important role in transportation and navigation. All flight, train, and subway networks form graphs, which can be used when creating efficient schedules. One of the most recognisable graphs is the London Underground map:

(3) Chemistry and Biology
The links between atoms in molecules and crystal grids form a graph.

(4) Social Networks
Use Case: Facebook, LinkedIn, Instagram use graphs to suggest new connections. Facebook, LinkedIn, and Instagram use graph algorithms to suggest new connections based on mutual friends, follower patterns, and shared interests. Machine learning and AI further refine these recommendations by analyzing user behavior for personalized suggestions.